tenHsEcm12xx Charts
To show a chart of energy consumption over the last 24 hours, click on the ECM
Charts button from the HomeSeer Status Page. The following
shows the HomeSeer screen:
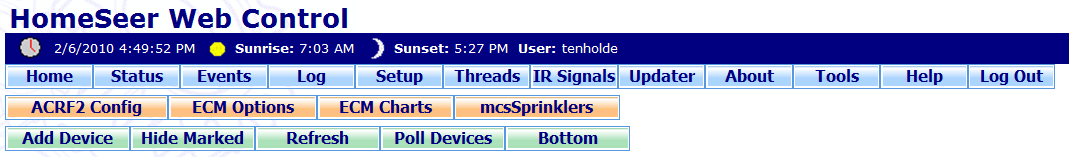
Click on the ECM Charts button and the Chart page will be displayed:
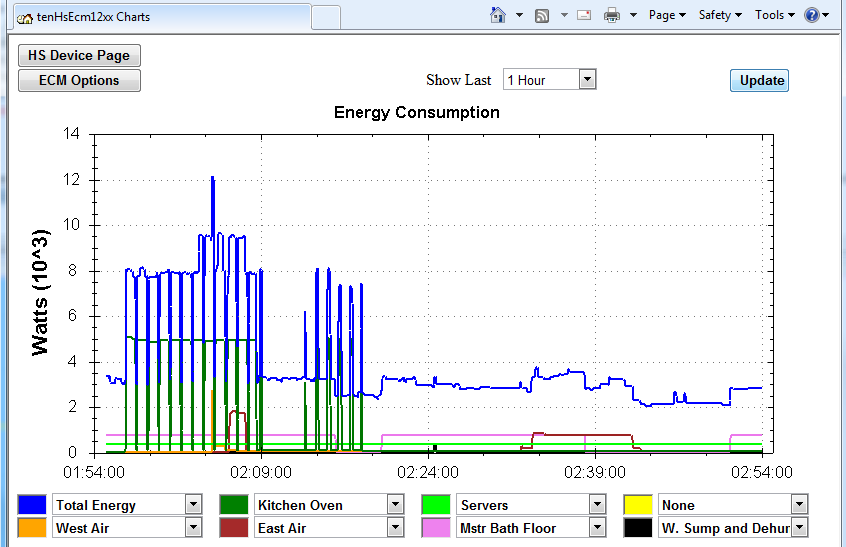
The chart displays up to eight selectible power measurements. You can select which of the
seventeen measurements (14 channels and 3 computed values) to chart.
The dropdown lists show the names of the measured channels as specified from the
Names Option page. You can also select the length of time to be charted
from the dropdown list.
You must specify (from the General Options page) that real time data is to be
accumulated (the default) in order to be able to display the chart. You
can also specify the page refresh rate for the chart on the General Options
Page.
You can display the realtime chart in a web browser from any computer on the
internet. For instance, to display the chart on a computer on your local
network, where HomeSeer is running on a server named HomeSeer and the
HomeSeer web server is using port 81, you could display the chart with
the following URL:
http://homeseer:81/tenHsEcm12xx/Chart01.aspx
You can include commands within the URL to customize the appearance of the chart.
The following commands can be used:
rr=nn Chart
automatic refresh rate in seconds. Specify rr=0 for no refresh.
cw=nn Chart width in pixels.
ch=nn Chart height in pixels
hh=y Hide chart headers
hl=n Do not hide chart
legend
hs=y Hide line selector dropdown
lists
sl=1-6 Timeframe displayed by the chart.
Values are:
1=5 min
2=15 min
3=30 min
4=1 hour
5=5 hours
6=24 hours
sc=n.n.n Specify the channels to chart. Specify
from 1 to 8 channels separated with "."
n= 1 for Net Energy, 2 for Generated Energy, 3 for Total Energy
4 for Ch1, 5 for Ch2
6-10 for Aux1-Aux5
11 for Ch3, 12 for Ch4
13-17 for Aux 6-Aux10
The URL
http://homeseer:81/tenHsEcm12xx/Chart01.aspx?cw=800&ch=300&hh=y&&hl=n&hs=y
would create the following chart:
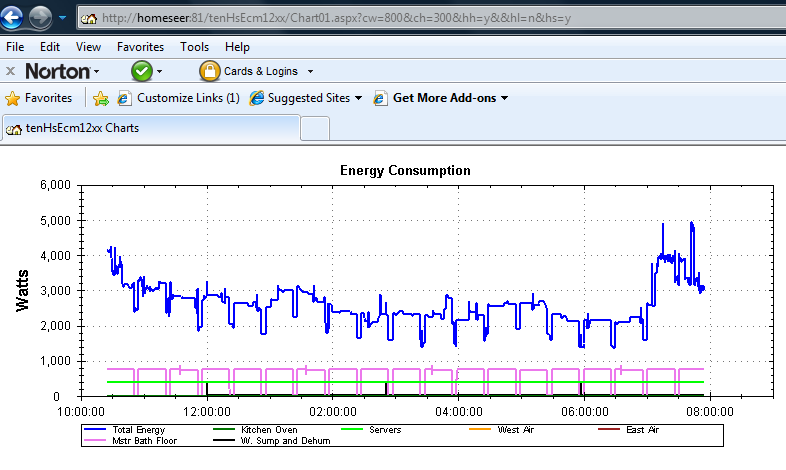
This can be used to create custom designed charts that can be embedded in other
html pages or applications. You could easily embed a chart in an HsTouch
screen, for example.