tenBtRealtimeChart Realtime Chart
The tenBtRealtimeChart program receives packets from tenBrultechServer
and displays channel data in realtime. A sample chart is shown below:
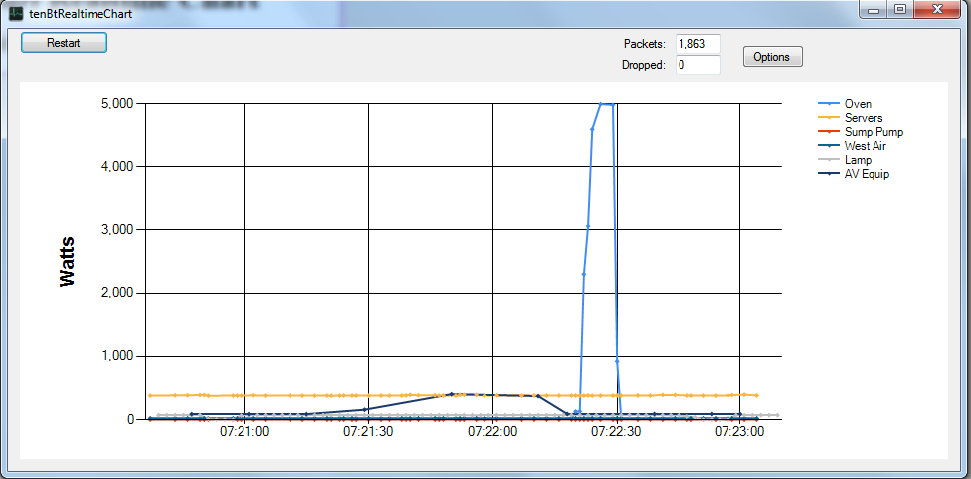
The top of the panel shows the number of packets received and dropped.
Data points are displayed as data is received from the server. Click on the
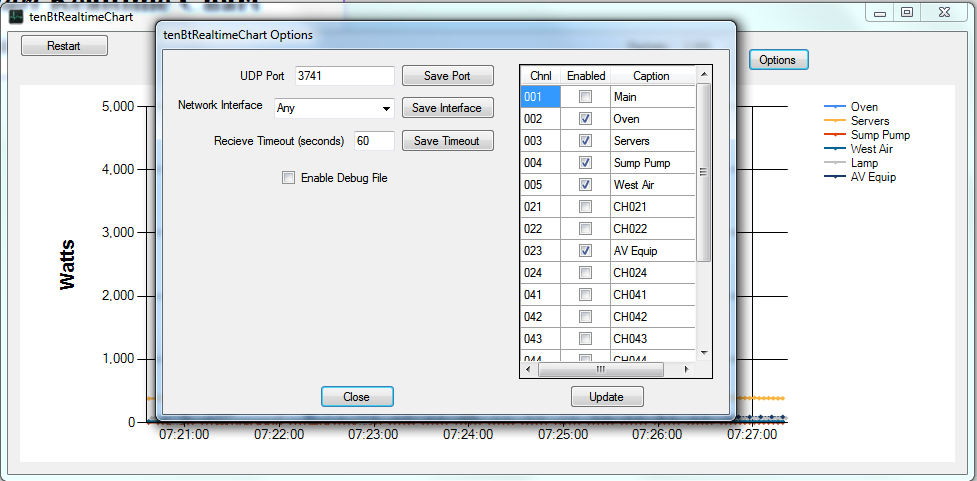
Options button to specify the UDP port that
tenBrultechServer is using to send packets, and to specify which channels
are to be charted, and to give each channel a name.
A sample Options panel is shown below:
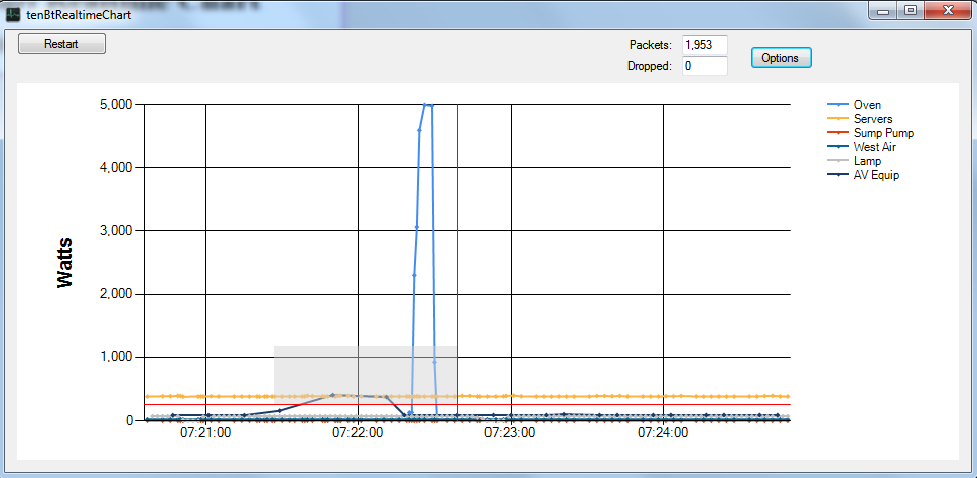
It is possible to zoom into an area of the chart to view a subset of
data rescaled for more detail. Drag a rectangular area on the chart
surface to zoom into that area. In the sample below, a small rectangle has been
dragged over a portion of the chart:
The result is that the chart shows only data from within the zoomed rectangle,
rescaling the chart:
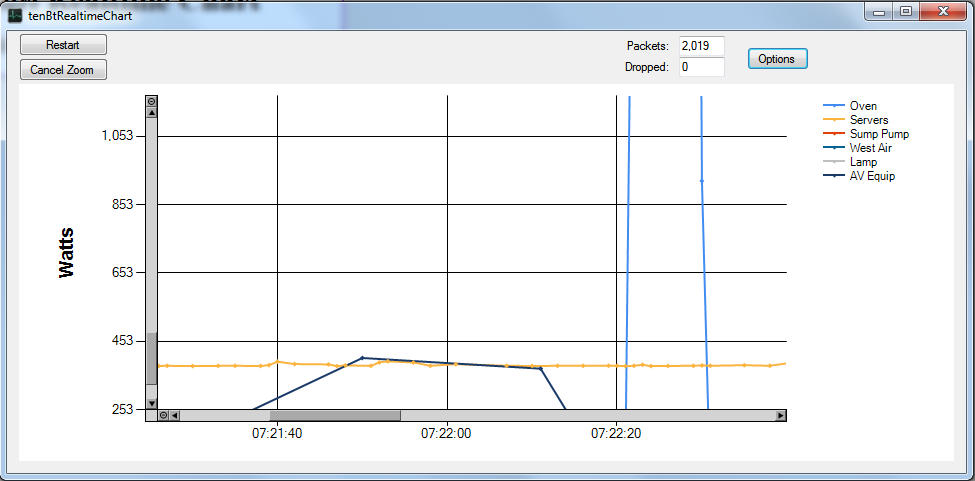
Scrollbars have also been added, as has a button at the top of the screen to
cancel the zoom. You can zoom multiple times. The button to the far
top of the vertical scrollbar and to the far left of the horizontal scrollbar
can be used to unzoom from just the most recent zoom. The Cancel
Zoom button will redisplay all data.
Downloads
tenBtRealtimeChart Version 37.6
12/9/2012
Added selection of Interval for time
range that data is displayed
Chart resizes with application window
Cosmetic and performance improvements
tenBtRealtimeChart Version 37.1 12/2/2012
Inital Beta Release