Charting Program for the Brultech ECM-12xx
tenEcmCharts is a windows program that charts both real-time data received from
the ECM-12xx and historic ECM data. Data for the real-time chart is
received from tenEcmServer broadcasts.
Data for the historic charts is retrieved from the SQL database maintained by
tenEcmDbLogger. All of these
programs are available free of charge. The following charts are available:
Real-time chart showing up to the last 60 minutes of
energy consumption:
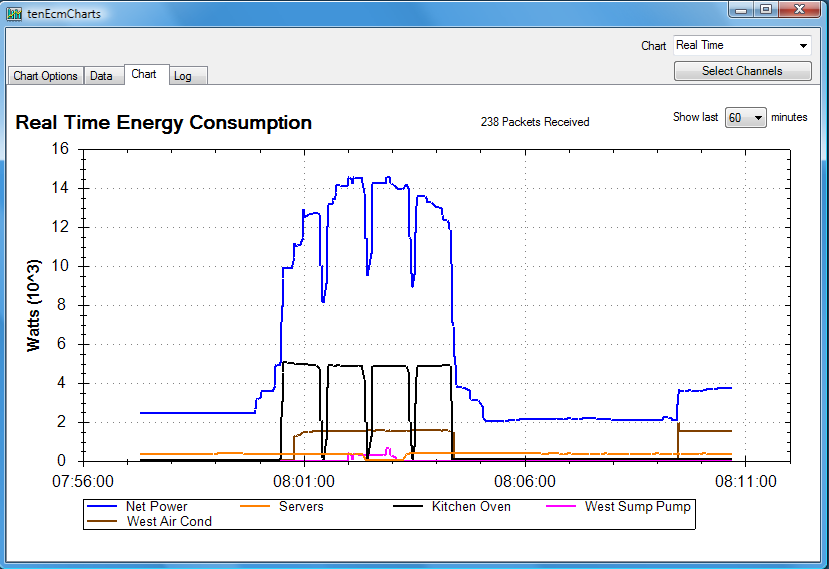
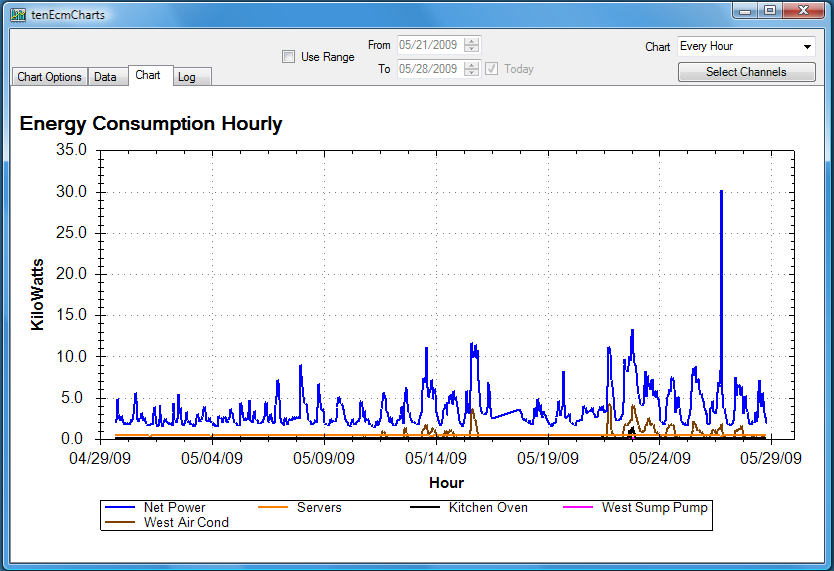
Chart showing historic data for each hour:
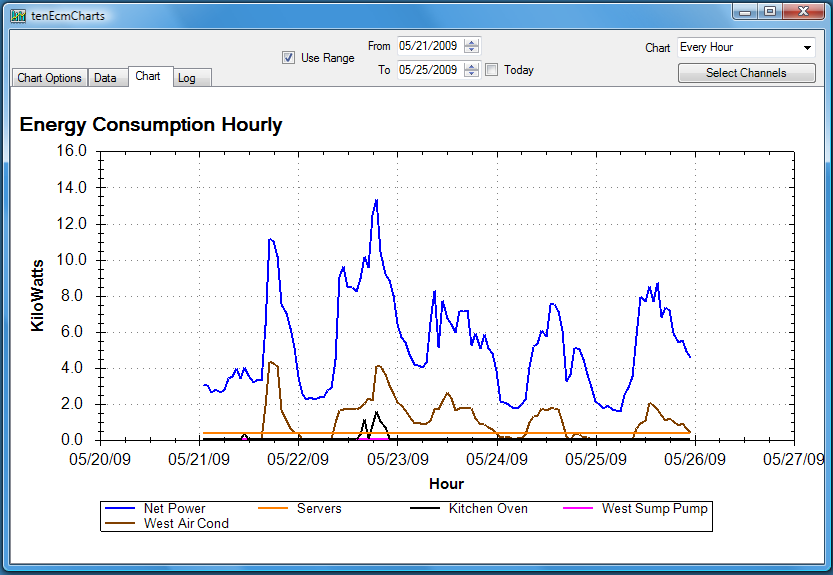
For each of the historic charts, you can specify a data range.
The following shows the same hourly chart with a subset of dates selected:
You use the Select Channels button to select which
of the channels are to be included in the chart. The following shows the
same chart again with a subset of channels selected:
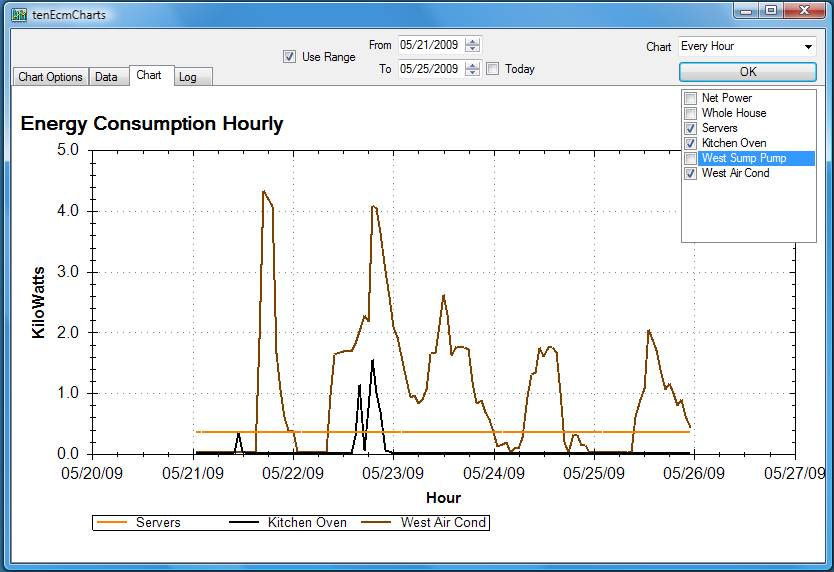
Chart showing historic data for each day:
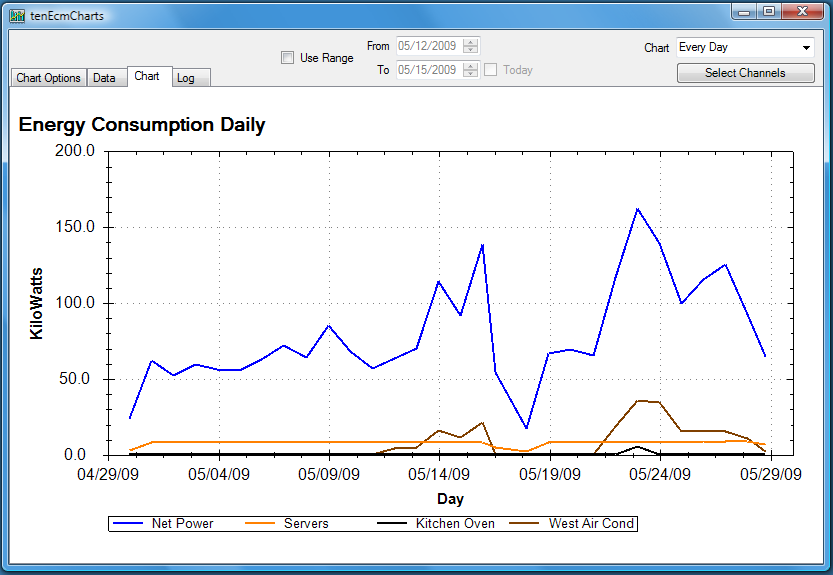
Chart showing historic data for each month:
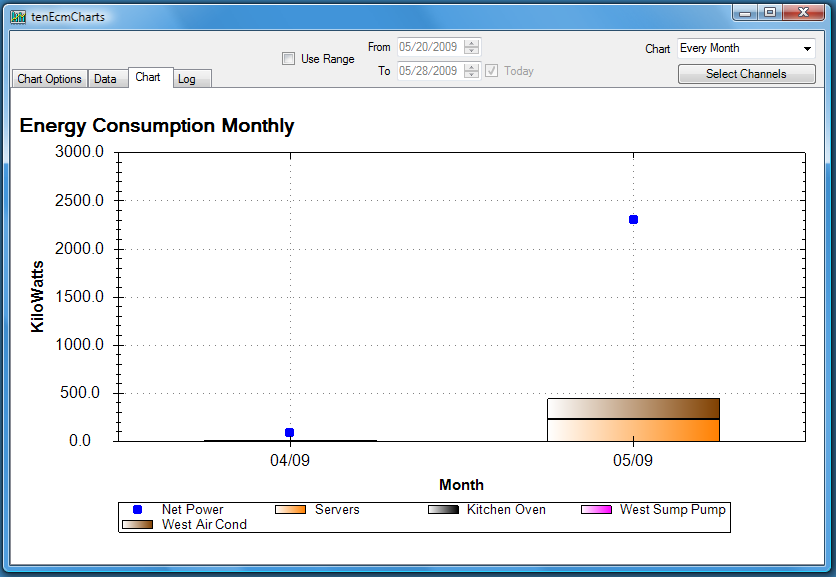
Chart showing average energy consumption for an
average hour of each day:
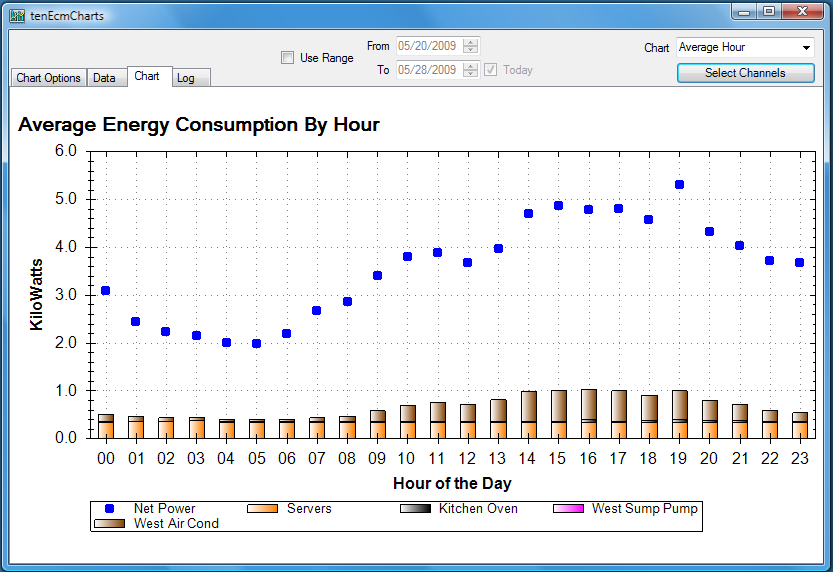
The last two charts (Monthly and Average Hour) are stacked bar
charts. A typical installation will have one channel that monitors the
net total power for the home, and several channels that monitor various home
circuits. It does not make sense to stack individual circuits with total
power (would be greater than total power), so these charts use a line graph to
chart net total power, and multiple bar graphs to chart individual circuits.
You specify which channel (Ch1, Ch2, or Ch1+Ch2) to use for
net power. If the Net Power channel is not select to be included in
the chart, then the line is not drawn.
In most installations, power is always flowing from the power company to the
home. A growing number of installations have the ability to generate some,
if not most, of the energy used by the home. The ECM and tenEcmCharts
accomodate such installations by providing a calculated channel called Net
Power. This derived channel is the net energy purchased from the power
company. Either Ch1, Ch2, or the sum of Ch1 and Ch2 continually measure
the energy flowing either FROM or TO the power company. This is always a
positive number. For installations that sometimes provide energy TO the
power company, the Polar counters (Ch1Polar and Ch2Polar) are integral to
calculating net power consumed. The Polar counters are also always
positive (or zero) and measure only energy flowing TO the power company.
Let's look at an example of Net Energy Calculation. Let's assume that Ch1 is
measuring both phases coming into the house from the power company. If 100w are
flowing FROM the power company, then Ch1=100 and Ch1Polar=0. Net Energy from
the power company is calculated as: Ch1 - (2 x Ch1Polar) = 100 - (2 x 0) =
100 net watts. If 100w are flowing TO the power company, then Ch1=100 and
Ch1Polar=100. Net Energy from the power company is again calculated as: Ch1 -
(2 x Ch1Polar) = 100 - (2 x 100) = -100 net watts. If you never provide power
back to the power company, then Ch1Polar and Ch2Polar will always be 0 and Ch1
and Ch2 will equal the net energy from the power company. (If your polar
counters always track equally with the base counter, ie Ch1=Ch1Polar all of the
time, then you have the polarity backwards.)
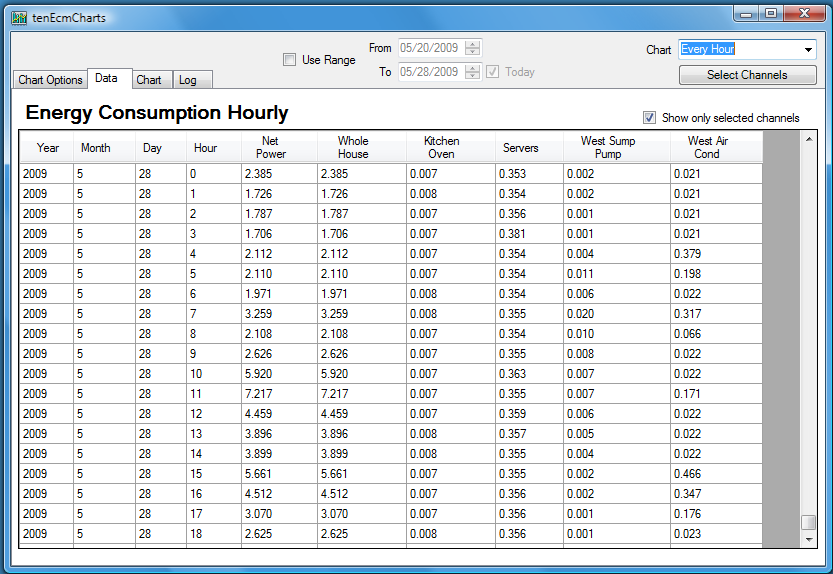
You can display the data for the current chart using the Data panel:
You use the Chart Options panel to configure tenEcmCharts:
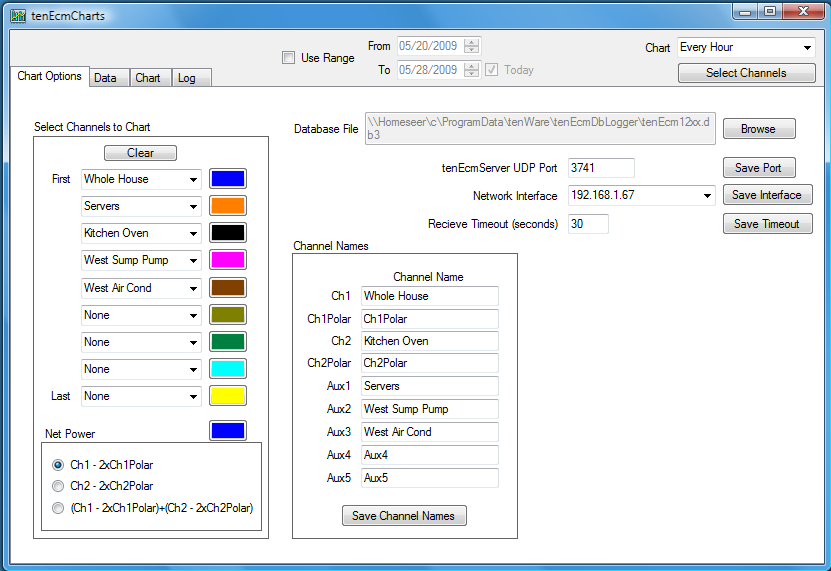
Database File
In order to display historic charts, tenEcmCharts
must access the database created and maintained by tenEcmDbLogger.
The program will attempt to locate the database file at the default
tenEcmDbLogger location. If a valid database file is not found at the
specified location, a warning note will be displayed in the log and the historic charts
will not be available. Use the Browse button to specify the correct
location of the database file.
Real-time Communications Parameters (tenEcmServer)
Specify the tenEcmServer UDP Port to use to listen for
broadcast packets. If you have multiple Network Interface Cards
(NICs), select one to use to receive broadcast packets. You can select
Any to have one selected for you. You can also specify a Receive
Timeout. If the program does not receive a packet in the specified
time, then it resets the network interface and reinitiates communications.
Specify a number significantly larger than the expected maximum time between
packets (based upon your tenEcmServer settings).
Channel Names
Provide a descriptive name for each of the ECM-12xx
channels.
Select Channels to Chart
You select up to nine channels to display on the
charts. For each dropdown list, select the channel (or None) to
display. Click on the color to the right of the dropdown to select the color to
use for the selected channel. All of the channels selected here will appear in
the Select Channel display on the Chart panel.
Net Power
Specify which channel(s) to use for the derived Net
Power channel..
Downloads
tenEcmCharts Version 1.16
2/9/2011
This version (and all prior versions) only supports
broadcasts for one ECM. The repeated error messages and dropped packet
messages for the broadcast messages from tenEcmServer for ECMs other than
number 01 have been eliminated. The next version of tenEcmCharts
will support up to 5 ECMs.
tenEcmCharts Version 1.15
7/25/2009
Bug fix: Should now run on Vista-64
tenEcmCharts Version 1.14
6/15/2009
Eliminated error message in log when minimizing the
chart.
Broadcast packets from ECM 2 are ignored. This is
to support tenEcmServer version 6.2 that now contains support for two
ECMs. Later releases of tenEcmCharts will support two ECMs.
tenEcmCharts Version 1.13
6/3/2009
The Channel Selections in the Chart panel are now saved
between executions
Increased data rows for real-time chart to 100
Now saves up to 24 hours of real-time data
Chart is now regenerated after the window is resized
tenEcmCharts Version 1.12
5/28/2009
You can now show all columns in the data grid, or only
those selected to be charted.
Dropped packets are now logged
tenEcmServer restarts are detected and logged
tenEcmCharts Version 1.11
5/25/2009
Total Power is now Net Power and is
computed as, for example, Ch1 - (2 X Ch1Polar) . This
calculation will yield the net power consumed from the power company, and will
be negative if you are selling power back to the power company. Note:
Ch1Polar and Ch2Polar must have their polarity set so that they
track power only in the direction TO the power company. tenEcmServer
now allows you to toggle the polarity of Ch1 and Ch2.
tenEcmCharts Version 1.10
5/23/2009
The channels displayed on the chart can now be selected
more easily from the Chart panel, without changing to the Chart
Options panel.
The Chart Options panel now allows you to
specify the color for Total Power
All channels are now displayed in the Data panel
You can now specify a network interface of Any.
Chart values can now be negative for those generating
energy
Real-time chart no longer updates when tenEcmCharts
is minimized (saves CPU)
Charting window can now be dynamically resized
Date-time added to log display
Bug fix: Real-time chart used client computer
time to select only 'last 5 minutes'. If server and client computer clocks
vary, the charting interval could be incorrect. Now uses time from the
server data to compute the interval
tenEcmCharts Version 1.9
5/11/2009
You can now specify a date range to restrict data
retrieved and charted
tenEcmCharts Version 1.8 5/9/2009
Improved network error handling. Added option to
specify UDP receive timeout.
Added option to use the sum of Channel 1 and
Channel 2 for Total Power
Bug fix: resolved problems with attempting to access an
empty database
tenEcmCharts Version 1.4
5/8/2009
Added capability to select Network Interface to use.
Computers with multiple NICs were receiving duplicate packets from
tenEcmServer.
tenEcmCharts Version 1.3
5/7/2009
Production Release
tenEcmCharts Version 1.2
4/29/2009
Just displays data from tenEcmDbLogger Database